
Domain monitoring guide
Domain monitoring is the scheduled workflow for domains that should be watched continuously. It differs from the ad hoc tools because results are tied to the organization, retained for review, and used by rules, alerts, reports, and response workflows.
Domains list
Section titled “Domains list”Open Domain monitoring > Domains to view the monitored portfolio.
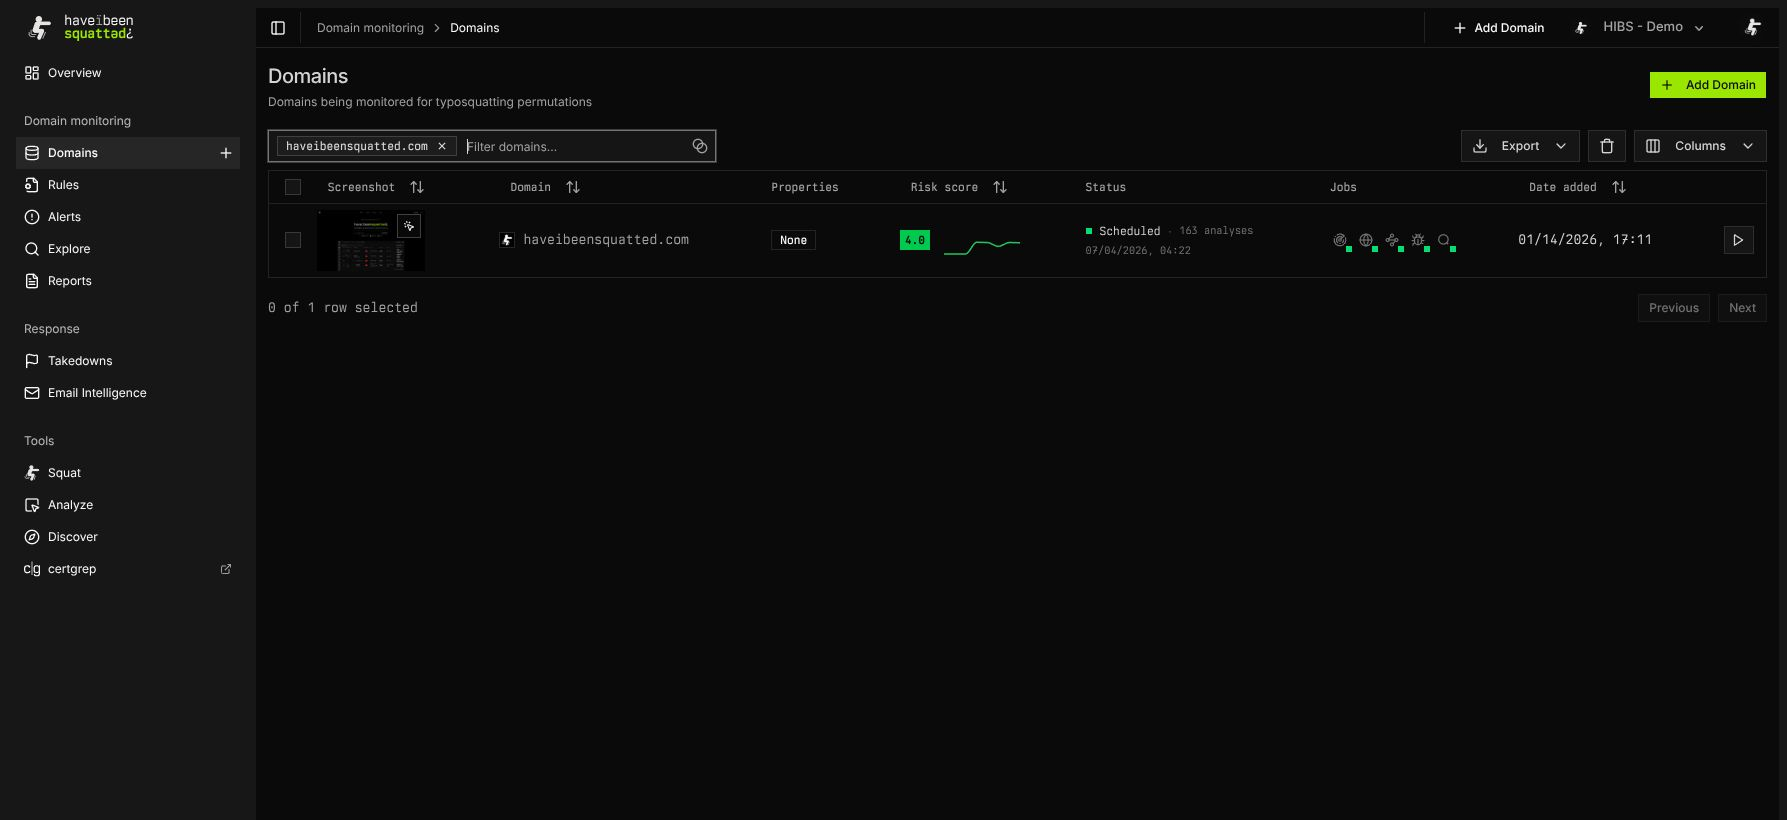
The table shows each monitored domain, screenshot availability, domain properties, risk score, scheduled job state, analysis count, and last scheduled time. Use the filter field to narrow the table, and use Export when the current portfolio view needs to be reviewed outside the console.
Select Add Domain to add a new monitored domain. This action is restricted to organization administrators.
Domain detail tabs
Section titled “Domain detail tabs”Selecting a domain opens a domain-specific workspace with three tabs:
- Overview summarizes status, recent analysis, risk movement, and coverage for that domain.
- Results lists lookup results produced by scheduled analysis.
- Settings stores discovery inputs that change future candidate generation.
The older lookup and diff routes can still appear from historical links or result records. Prefer the current Results tab for routine review.
Discovery settings
Section titled “Discovery settings”The Settings tab lets administrators tune discovery for a domain.
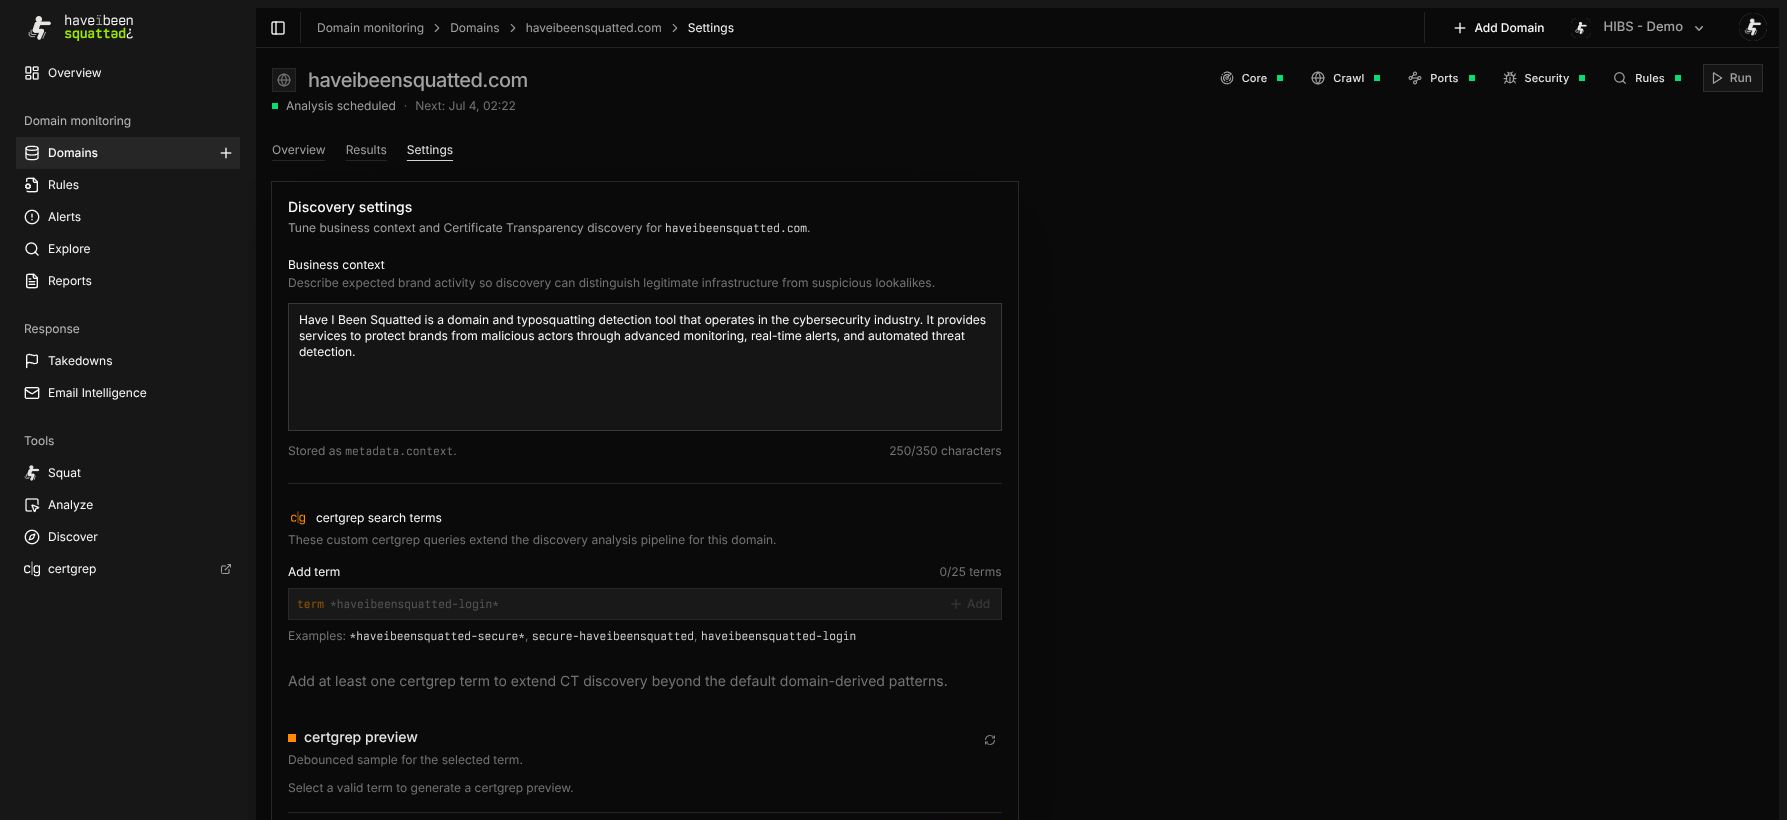
Use Business context for expected brand activity, common legitimate campaign names, known subsidiaries, and other context that helps separate legitimate infrastructure from suspicious lookalikes.
Use certgrep search terms to extend certificate transparency discovery beyond the default domain-derived patterns. The preview uses the public CT search pipeline, so broad expressions can produce noisy candidates.
Organizations with the Site Canaries add-on can use Site Canaries to create and manage JavaScript tripwires for the monitored domain. See the Site Canaries guide for deployment, hostname, and activity details.
Results and enrichment
Section titled “Results and enrichment”Domain results combine generated permutations with enrichment from DNS, HTTP, RDAP, WHOIS, screenshots, CT data, passive DNS and Transport Layer Security (TLS) observations, classification, page rank, crawl signals, and related metadata when available.
Open a result to inspect the detail drawer. The drawer groups data into tabs such as Overview, Sitemap, Network, Certificates, and Passive DNS. Secondary actions can copy a display-safe JavaScript Object Notation (JSON) payload, open certgrep, open the analyzer, or start a takedown request when the feature is enabled.
Missing enrichment usually means the signal was unavailable, timed out, or did not apply to the domain. Treat absent data as “not observed” rather than proof that a signal does not exist.
Alerts
Section titled “Alerts”Open Domain monitoring > Alerts to review rule matches across monitored domains.
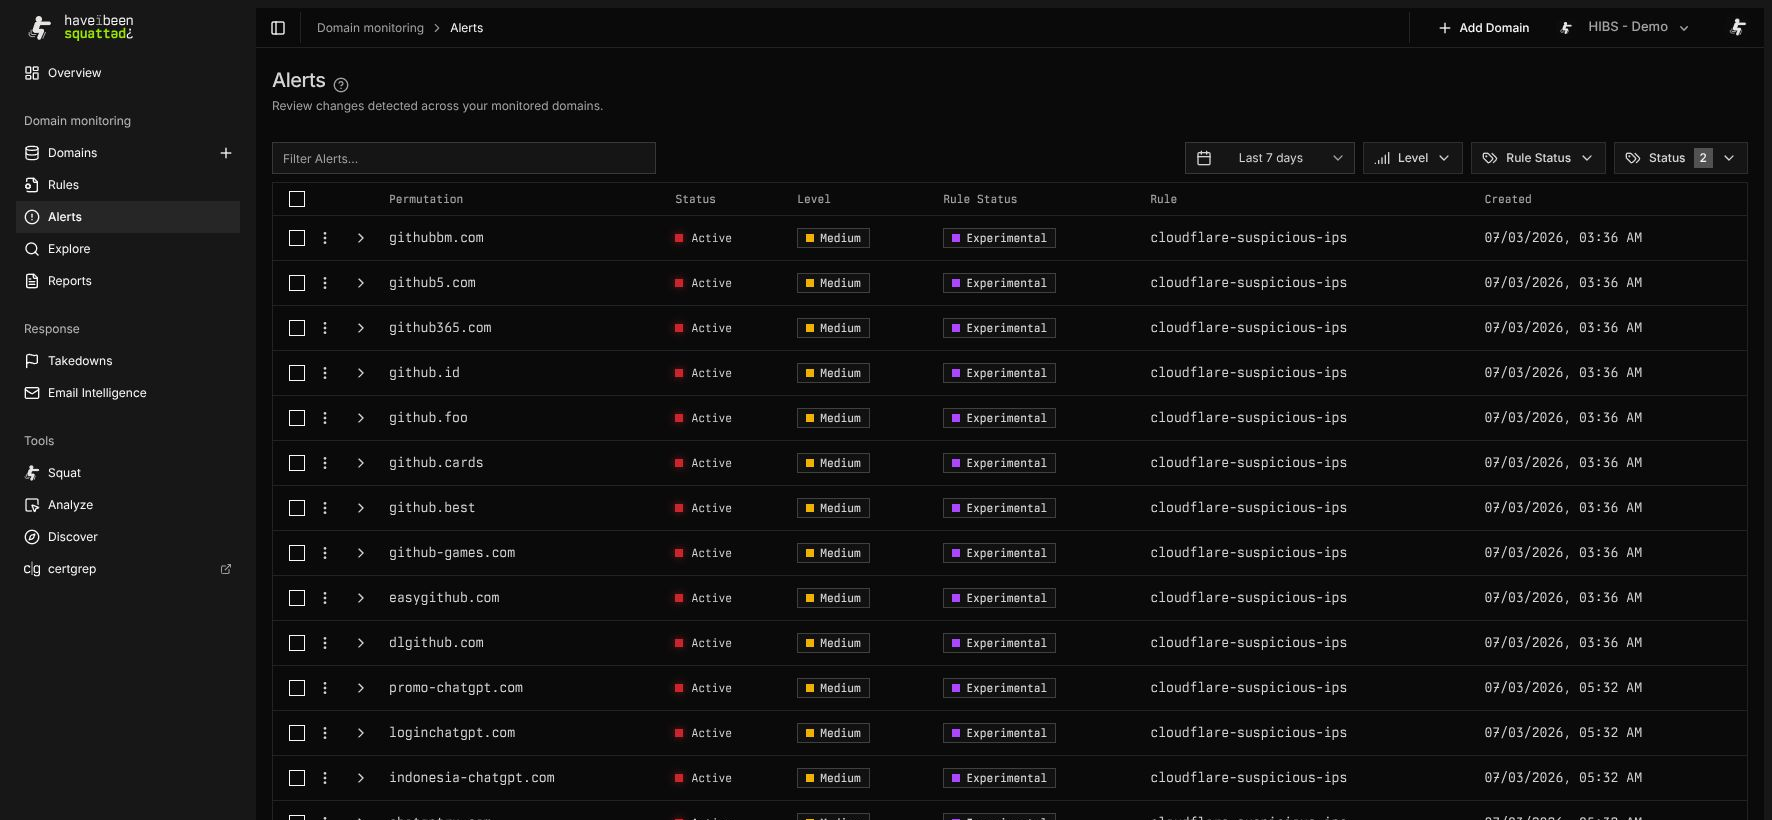
Alerts can be filtered by time window, severity, rule status, and alert status. An empty state means no alert matches the selected filters, not necessarily that the monitored portfolio has no lookup results.
Alert severity uses critical, high, medium, low, and informational. Rule maturity filters use the current user-facing statuses documented in the Rules Engine guide.
When to use each surface
Section titled “When to use each surface”- Use Domains to manage the monitored portfolio.
- Use a domain detail page to investigate one protected domain.
- Use Results to inspect individual permutations and enrichment.
- Use Alerts to triage rule matches.
- Use Explore for cross-domain queries that are too specific for table filters.
- Use Reports to package coverage and response evidence for stakeholders.